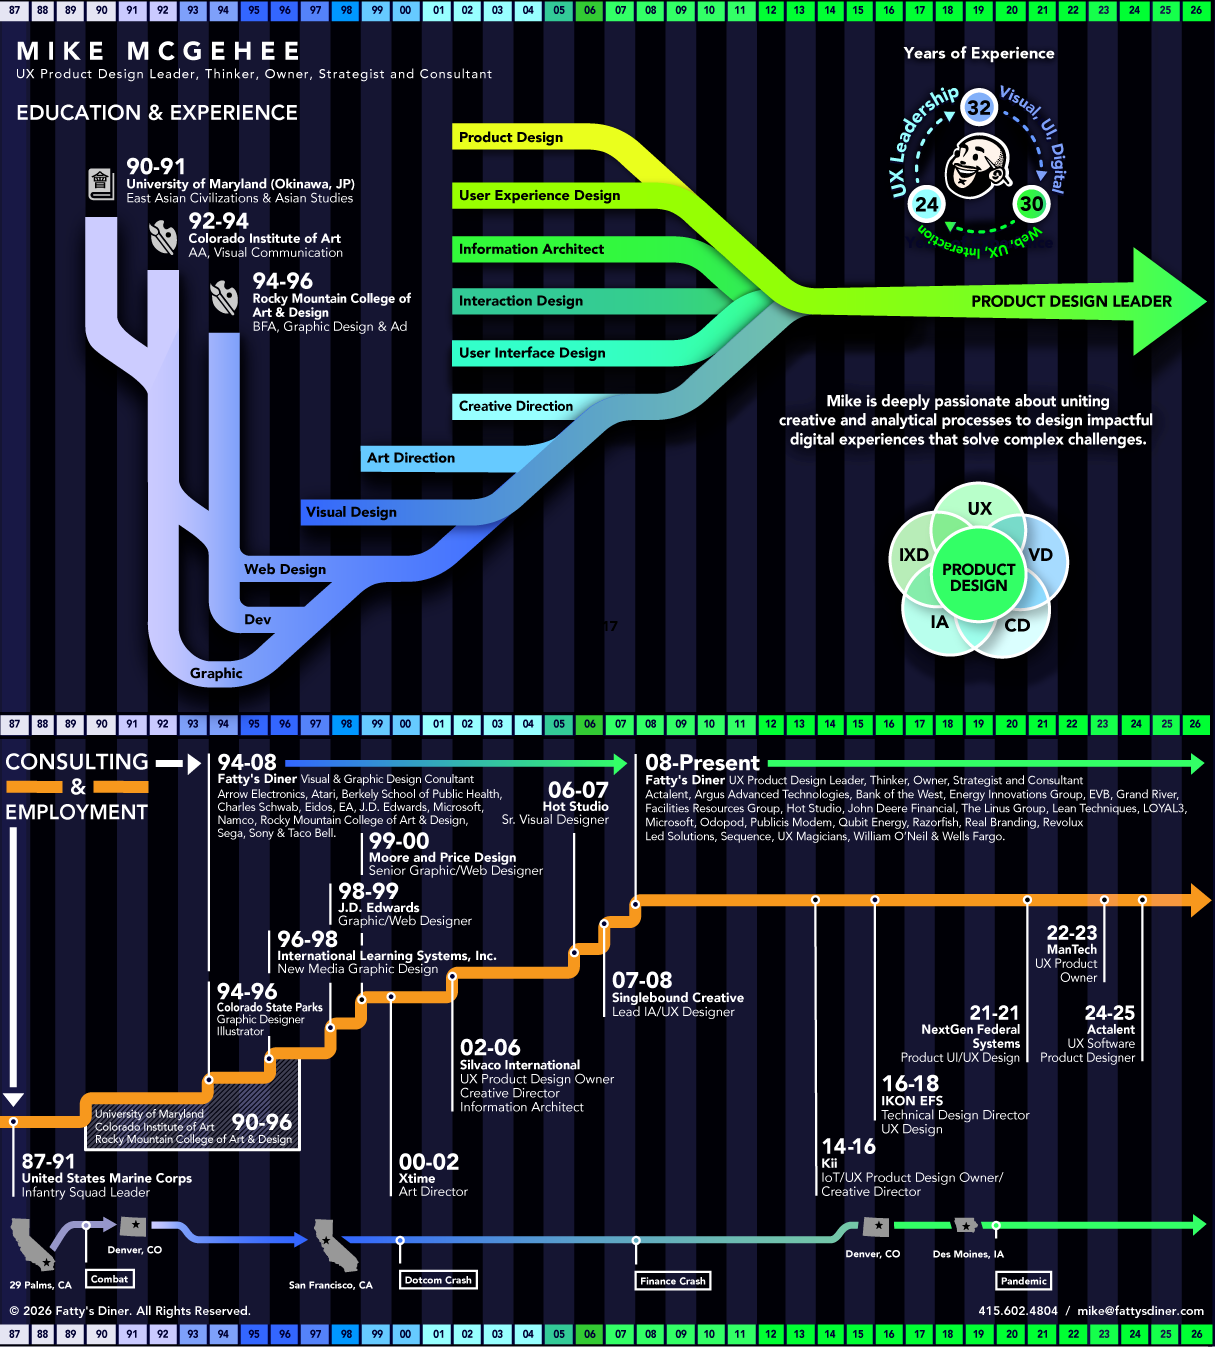
Mike‘s History
An engaging visual timeline that tells Mike’s story—from education to experience to career milestones—in a dynamic, easy-to-follow format.
Agile & Design Thinking Process
A fine-tuned approach—streamlining the process, cutting the noise, and perfecting a system that delivers consistent results.
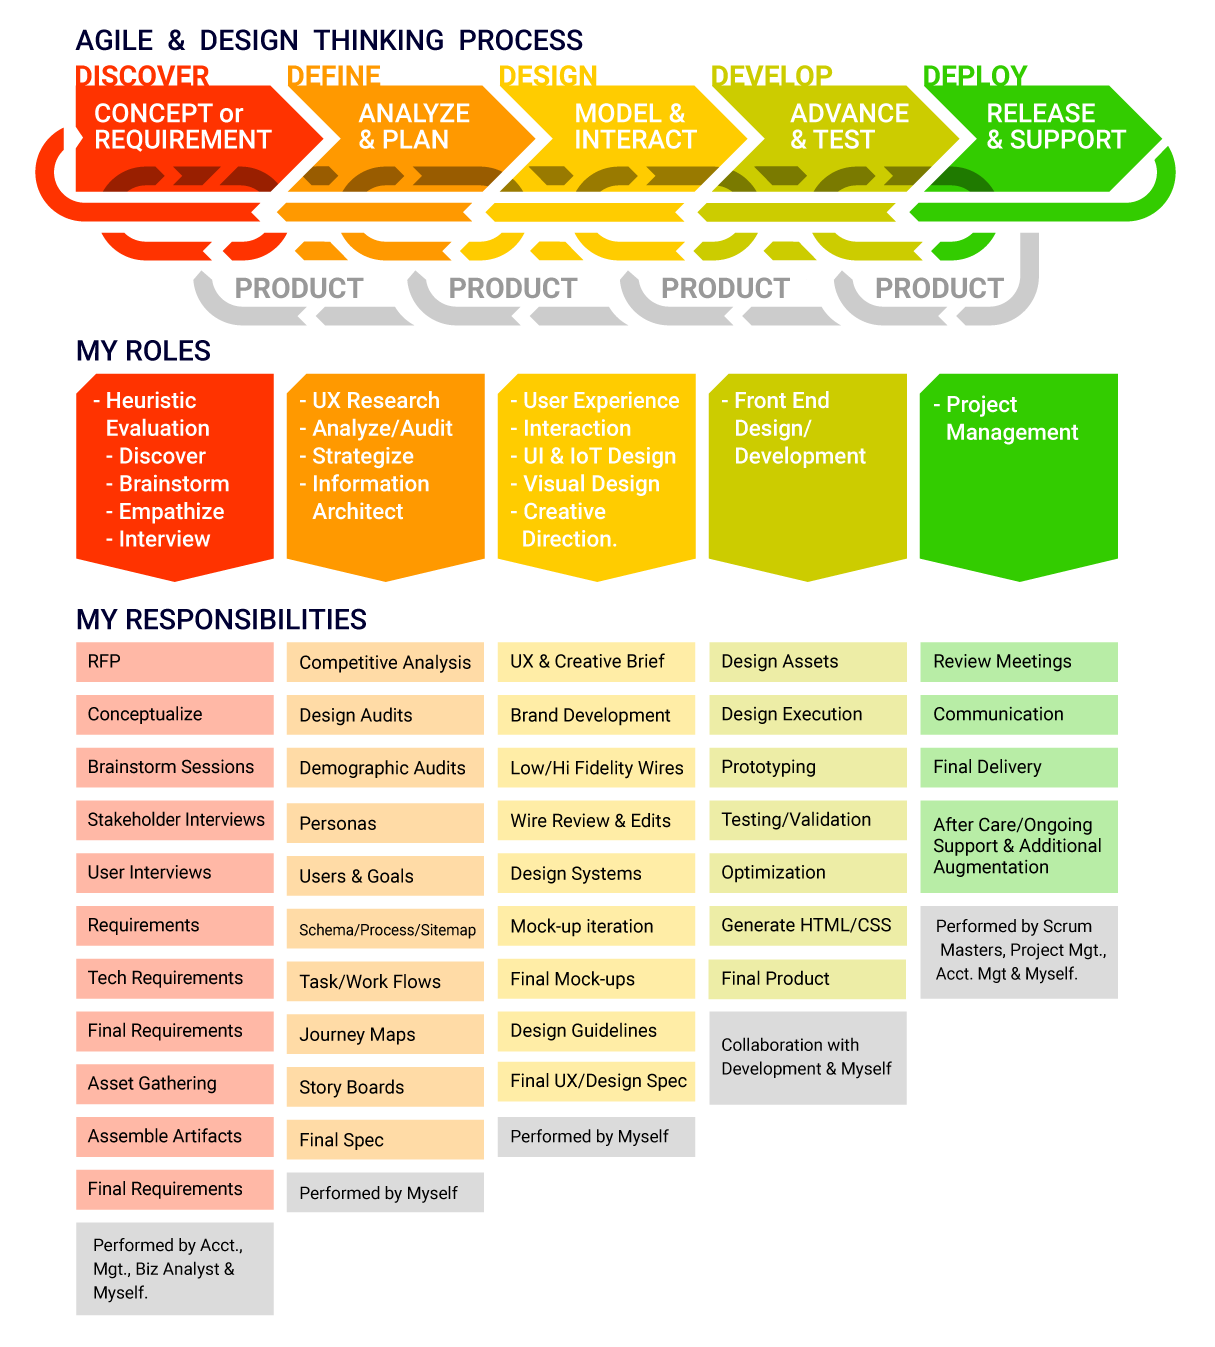
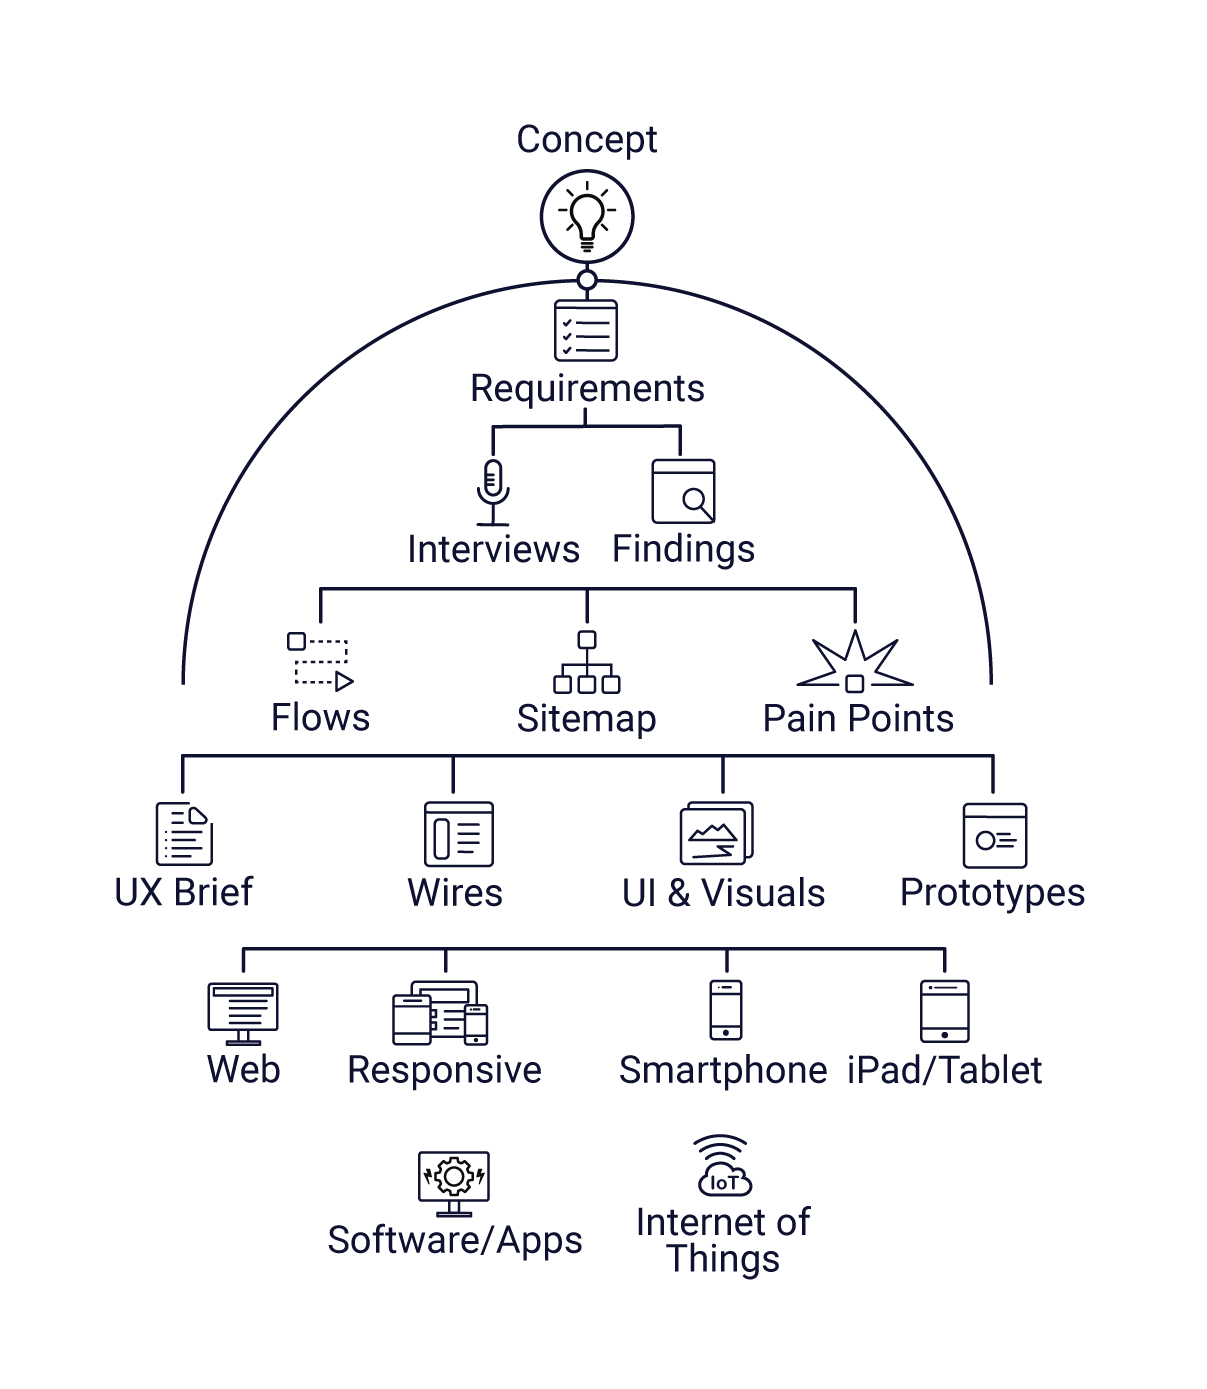
Agile Design Thinking Process
Translated business goals and user insights into clear experience strategies—moving from concept to validated products.
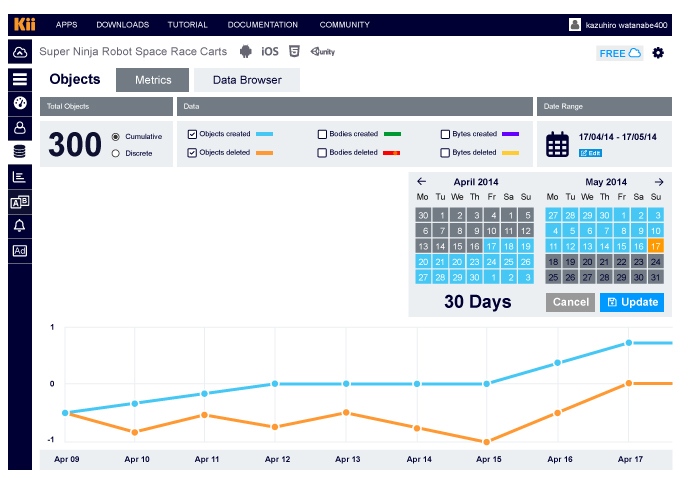
Platform Metrics
Viewing the metrics of your objects in your mobile app.
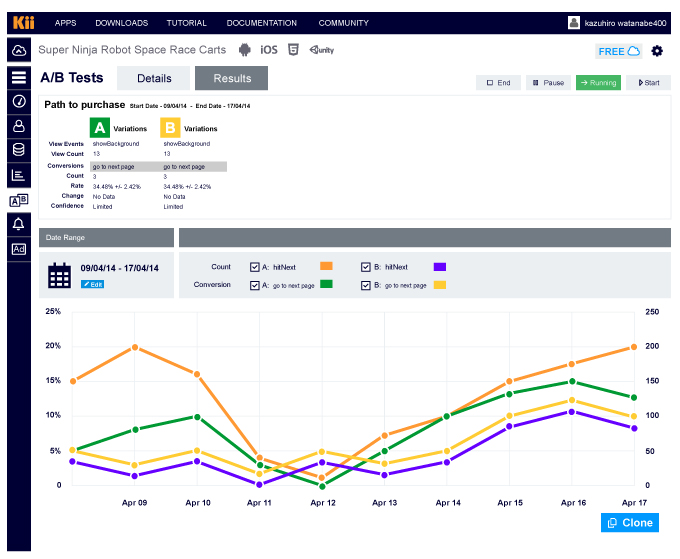
A/B Tests
A/B testing reduces risk by replacing opinions with evidence.
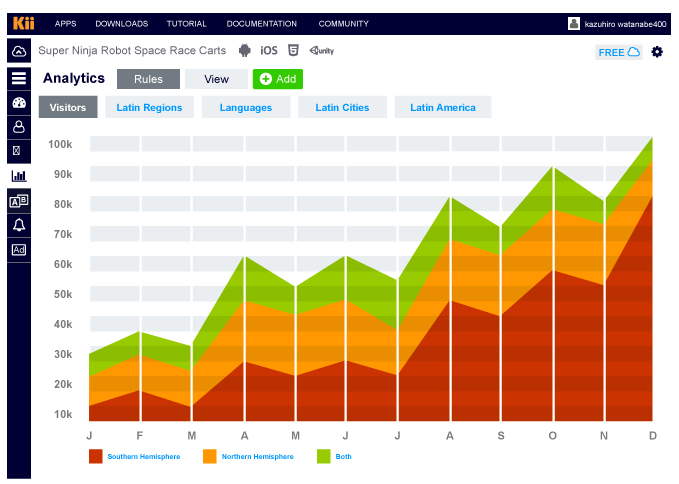
Analytics
Measuring traffic: Who, What, When, and Where using your app.
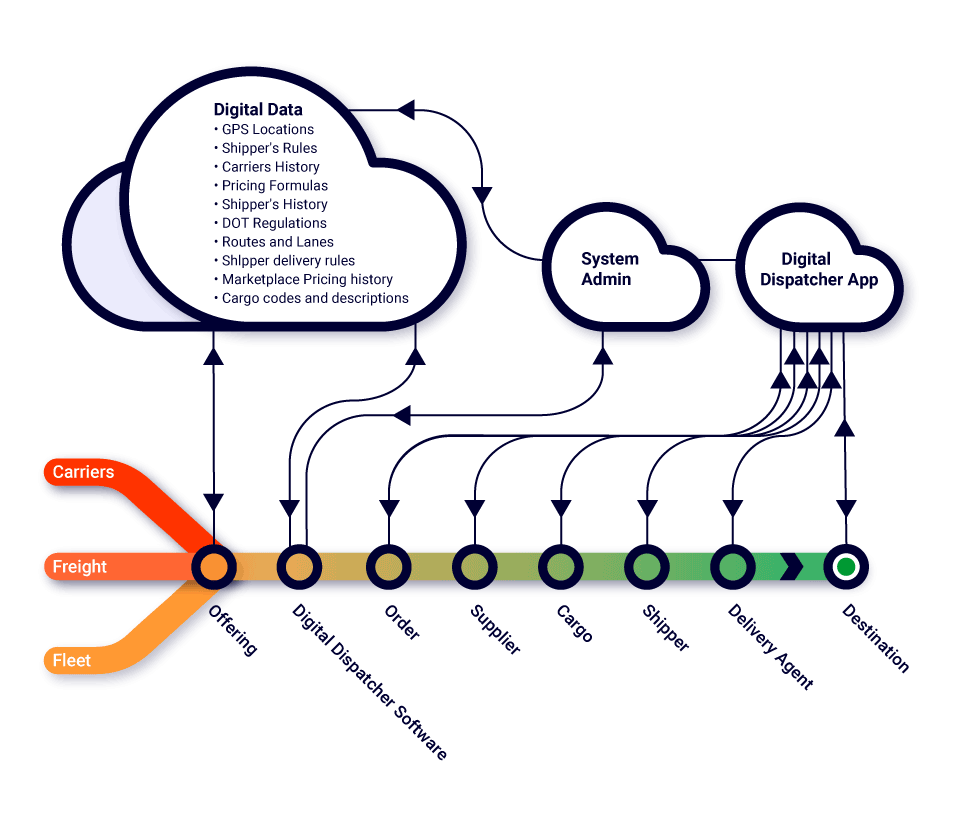
Vision Map
Aligning the product vision for specialized services and applications.